Often we have heard talk about performance at a web or backend level. We have heard about servers, cloud testing, and more, but have you ever heard about mobile performance testing?
As a performance test engineer, there are some tasks where my team and I can collaborate in order to deliver a mobile application with better quality. It’s the sort of thing our Studio does in cases like this one.
But, as a starting point we should clarify what I mean when I say “mobile performance.” Can we load and stress a device? How?
What does mobile performance testing mean?
People always ask me how I stress a device. That’s because we are used to correlating performance testing (the practice) with load or stress testing. What people don’t know is that there are many other ways to apply performance techniques to development projects. And mobile performance testing is one of those techniques we can apply when developing or working on a mobile application.
So, the answer is no, we do not stress or load a device or an application. Phones are used by just one person (no load is needed). What we do instead is measure the performance of our application when it is running in our device. We look at how it manages to share mobile resources with other applications on the phone.
Basically, for testing we measure performance metrics like CPU, memory usage, and crashes among others, and we work with the development team to optimize those values.
As performance engineers, we are very used to work looking into threads, memory objects, net traces of applications hosted in web application servers. We can use that experience to look into what is happening deep down in our mobile app and find opportunities for improvement.
As with many other techniques, we should ask…
When is the best time to start doing this?
The first project I faced this technique, we started measuring performance in the 12th sprint. We were using scrum framework, with two weeks per sprint. We started to measure performance at that point because our application was crashing a lot. Of course, that was giving users a really bad experience using the app.
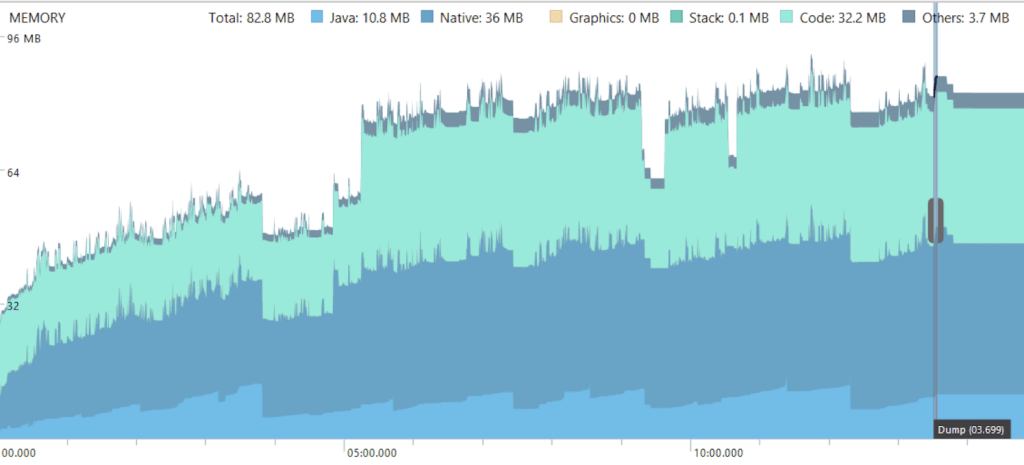
So, at first, I started looking into memory usage (on a hunch) and I saw this:

We weren’t releasing the memory appropriately. That was one of the first points we needed to analyze in the performance of our app.
In that moment, I regretted not starting to measure this earlier. Like five or six sprints earlier. So, when do I recommend starting? I think that in the first release to QA is the way to go.
But, in addition to memory…
What other elements should we measure?
We can keep track of several metrics that will help us better understand the performance of our application.
Event response time
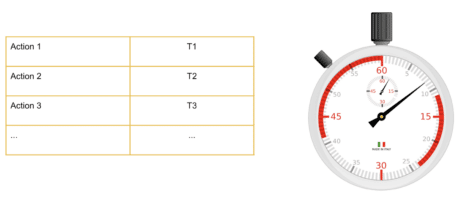
Response time is one of those elements we can measure, meaning application actions or event times. In order to do so, it’s important to define a flow by which we’ll measure:

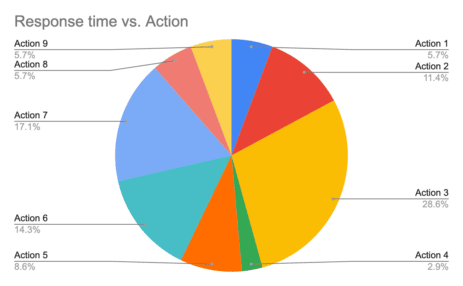
With this information in mind, you can determine which action or event is slowest in your application. Also, you can easily show the pain points of your application to your team in a pie chart.

In the example, you can see Action 3 is taking the biggest percentage of the time when a user is using the application and following the defined script. This is valuable information to share with the team.
But what we need to know now is why that particular action or functionality is taking so much time. Is it because of the service(s) involved in the action? Or is it because the application is taking time to draw and display the screen?
Well, the only way to find that out is measuring (yes, again!).
Services response time
If you connect a device to a proxy, you will see all the services called by your application. In a certain way, you can correlate actions, with API-calls or services, and of course, you can take the action time from the services side doing this analysis. You could take this time from the proxy software itself (Fiddler, Charles, or any other proxy).

Then, using the same table as before, you can now add a row that details the service’s time:

One idea that works for me is using this data to show the percentage of the time that the application takes to call the service. Once it has the response, you can show the percentage of time it takes to draw and display the answer.
This information helps you gain another perspective on the metrics, because you can easily recognize whether a screen is taking too long to show a response.
At this point you also can try switching the connection configuration (3G, 4G, LTE, Wifi, etc) and compare the times and performance.
KPIs
As with any application, you can measure key performance indicators like:
- % of the device’s CPU the application is using
- MBs the mobile application uses (Memory)
- KBs your application sends and receives (Network)
- % of battery the phone consumes while using the app
Later we’ll focus on tools, but it’s important to mention now that there are some tools that could help us with these kinds of metrics.
It’s essential to keep track of these metrics in order to identify the exact moment that the app introduces an error. These metrics can also help detect the moment that the app degrades its performance. The question is, when is a good moment to take these metrics? Well, after each release is a good start!
You can show your team how the performance progresses after each release, in terms of KPIs.


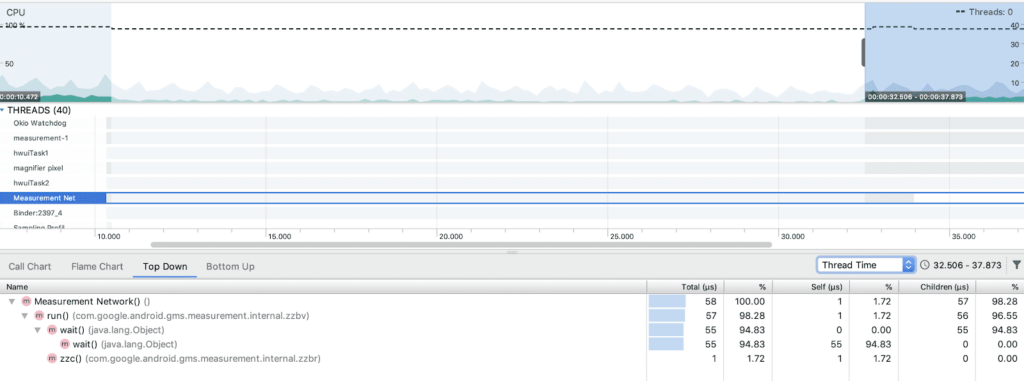
And so on. Also, you can zoom in into the resources and analyze threads, memory objects, received and sent data, and connections.
This information is really important to fully understand how your app is working. You’ll also be able to understand how you can improve the app. And you can get all this data by just profiling the application.


As I said before, there are tools…
Now, let’s talk about the tools that help us to achieve all these information shown before.
Measuring events’ response time is something I prefer to do manually with a timer. But another option is (depending on the application) to use an automation framework and enter your code time marks.
As I mentioned earlier, to measure services time you can connect the device to a proxy tool (like Charles or Fiddler). You also can take the services time using Postman or any performance tool like JMeter. However, I prefer to trigger the services directly from the application and the device that I’m using to measure the performance.
In the proxy you will see the list of requests involved in your actions and events, and also it will show response time data.
Finally, for profiling purposes, you can use Android Studio (for Android devices) and Instruments (for iOS devices). There you will find resource consumption information and details of what is happening deep down in the device. I use them a LOT to debug the application and find improvement opportunities, like memory and processing optimizations.
Apart from those tools, you can also get some support from tools like Browserstack, Seetest, Apptim, and Kobiton to run the tests and take metrics of resource consumption (CPU/Memory/etc).

As mobile performance testing is a pretty new practice, I have faced some challenges. For example, (at this time) there is no automatic tool to measure screen load time to native applications. It would be great to hear about a tool for doing that. So, if at the time you read this article you know of a tool for that, please let me know!
On the other hand, there is an issue with Instruments that prevents the measuring of battery consumption on iOS devices. I hope they solve that issue soon.
Now that you have all the info…
In closing, I highly recommend that, after you go through this practice, you drop all the resulting information on your app’s pain points into a delivery document to share with your team. List the metrics, KPIs, and findings from your mobile performance testing. Don’t forget to list the devices used for the testing, app version tested, and all the necessary information in case your colleagues want to repeat the test.
I’m still working on this field in my projects, so I’m constantly learning about this amazing topic. But it’s always worth sharing what we’ve learned up to this point in order to exchange experiences! Hopefully you’ll be able to apply this practice to your mobile apps. And please, let me know about your results.


