Introduction
As bioinformaticians sometimes we are asked to analyze the way that organisms evolve over time, from a genome point of view. The branch of bioinformatics responsible for that kind of analysis is called phylogenetics. In this article, we will talk about COVID-19.
Note that I group this area under the umbrella of bioinformatics instead of biology, just because of the way that the analysis is done, which I’ll deep-dive later on.
A phylogenetic analysis can reveal relationships between species, or said in a different way, how related are two species. Knowing the relationship between species is an important matter that can help people to make decisions about certain topics.
Thinking about the COVID-19, we can use phylogenetics to investigate what other coronaviruses are similar to, in order to formulate a hypothesis in regards to where the virus is coming from and how it globally spreads out.
How to conduct a phylogenetic analysis?
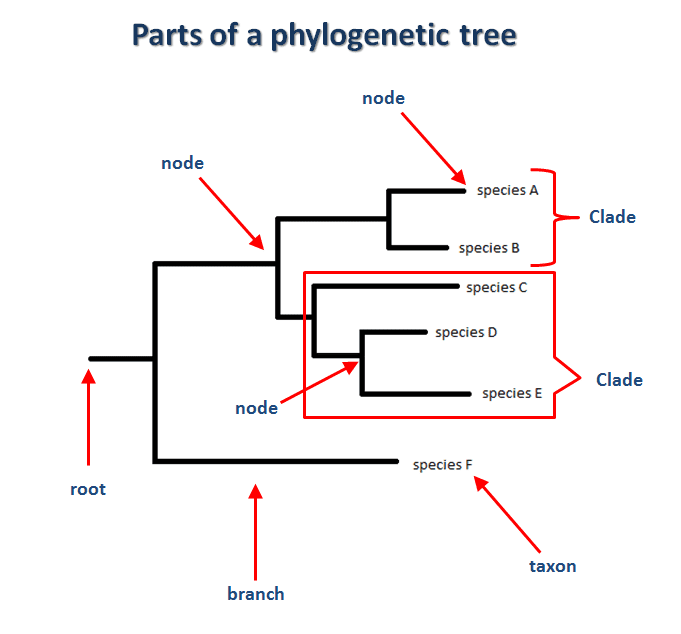
One of the main tools to be used is called a “phylogenetic tree”, which is a structure shaped like a tree, where the leaves are the genome samples of the organisms and internal nodes are considered the common ancestor of the child nodes.
The branches represent the relatedness of the samples. The shortest the branches the more related those two samples are. The distance between two samples is called “genetic distance” and can be defined as the number of substitutions (on their genomes) accumulated between them since they diverged from the common ancestor.
See next an example of a phylogenetic tree for different species:

A clade is a sub-tree which the root is the common ancestor and the rest of the nodes, all the descendants.
Another way of interpreting a clade is to think about them as a cluster that groups species that are related to each other.
There are different methods to measure relatedness or distance between samples and is not part of the scope of this article to deep-dive into them, all it matters is that each method has pros and cons and they give us a distance value that can be used to create a distance matrix, needed to create the tree.
Creating the tree
Without losing ourselves into technical details of the algorithm, we can safely say that the tree is created bottom-up, going from the leaves (taxon) to the parents’ nodes.
Since everything starts in the leaves, that means that the input to construct the tree will be DNA samples of the organisms intended to be studied. For COVID-19, it is obtained with a Nasopharyngeal (NP) swab.
The sample is used as input in a sequencer device. As a result, what is obtained is the DNA sequence of the organism, a list of letters A,T,C,G representing the entire genome of that organism.

The genome determines what the genes are, how they are expressed in the organism, how the virus is replicated and many other aspects, hence is our main subject of study for our analysis.
Having the sequenced genome of the sample, we now have the leaves of the tree, the next step is to create the internal nodes of the tree, based on the distance of each previous node calculated.
When we create the tree, we are ready to start doing the analysis and formulation of hypotheses.
COVID-19 analysis
Is important to note that phylogenetic trees don’t represent facts, they only show relations that we can use to infer facts.
Let’s create two trees:
- The first one to see how the human-version of the virus is related to the same virus in other species, in order to determine if this is a cross-species virus.
- The second one will be created using only human samples and we are interested on the country from where the sample was taken, in order to infer how the virus spread globally, based on its tiny mutations.
Where does it come from?
Let’s assume you are a bioinformatician in charge of investigating the origin of this virus, which could be used later on in order to get hints about how to find a cure or ways to prevent it.
Provided with genome samples of the virus, collected from infected people, and access to public databases that keep records of known disease genomes, a particular phylogenetic tree can be constructed, taking one representative genome sample of each species (including homo sapiens of course).
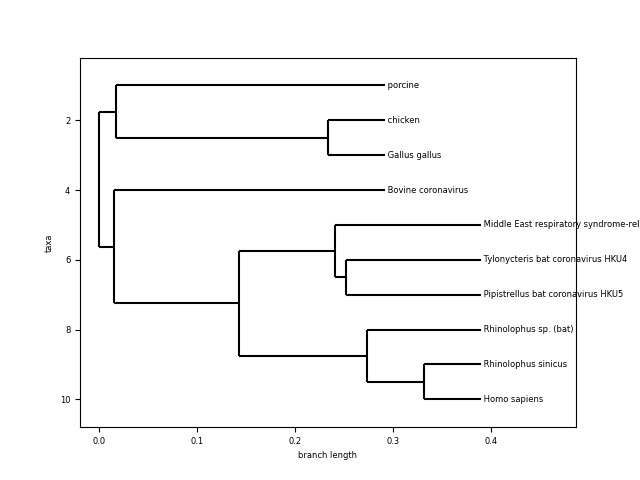
For the next example, I created an algorithm that will search public databases looking for genomes of known SARS coronavirus on different species. We will take 9 coronaviruses from non-human species and one sample from a human COVID-19 (Details of the sample: link).
Someone may ask “why don’t compare all possible sequences for any known species?”. That is a valid question from a biology standpoint, the answer, and limitations actually, comes from the computational method used to compare the sequences.
The algorithm will have an astronomical computing complexity. Aligning sequences (Sequence alignment: link) in order to calculate the distance between each other is a non-solved computational problem (Multiple Sequence Alignment : link) with exponential time complexity.
Just to give you some numbers, aligning 10 sequences of SARS coronavirus genome on a laptop with i7 9th gen processor and 16 GB of memory takes ~ 2 hours. To align 50 sequences it takes ~18 hours. Also, we are talking about a small genome, the human genome is ~100,000 times bigger (SARS coronavirus has a length of ~30,000 bases, the human genome is about 3 billion).
Finally, before jumping into the resulting tree, it is also worth mentioning that this was created for illustrative purposes only, results can be refined in many ways.

A few comments:
- Looking at the length of the branches and common ancestor, Homo sapiens coronavirus seems to be very similar to the one from “Rhinolophus sinicus” and “Pipistrellus bat”, “Tylonycteris bat” and “Middle east respiratory syndrome…”. What are those?
- Coronavirus from other species (porcine, bovine, chicken and gallus gallus) seem to be more distant and have a more distant common ancestor.


The evidence from the tree seems to indicate that the human novel coronavirus is closely related to the same kind of virus coming from bats. This is actually the working hypothesis for the scientific community.
How did the virus spread out?
Considering the fact that each contagion of the virus may provoke very slight changes on its genome (RNA viruses like COVID-19 have a higher mutation rate than DNA viruses: link), measuring those tiny differences can help to analyze the pattern by which the virus spread all over the world.
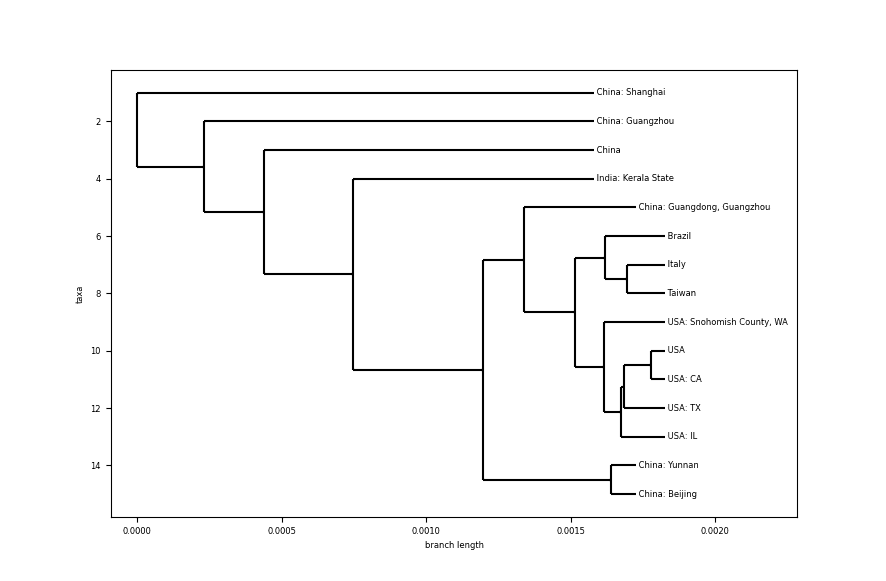
For this analysis, I created an algorithm to grab genome samples of the virus from infected patients from 20 different countries. Aligning the sequence with the same tools used in the analysis of the previous tree, the next result was observed:

Some comments:
- Looking at the scale of the branch length, the difference between samples is really small. Comparing with the species phylogenetic tree, differences between bat coronaviruses and other species is ~0.1, here, differences between different humans infected are about ~0.0005 (no need to dive deeper on the scale).
- Samples from USA all have the same common ancestor, which seems to indicate a close relationship between them.
- Reading the tree from the outside to the core, it starts with the top branch, coming from a sample from Shanghai, China. Samples continue from China as we go deeper, except for a sample from India, in the state of Kerala. Could it be a person directly infected from a Chinese person. Let’s dig on this a little bit more.
- The particular case of India is a case related to a student (link) returning from Wuhan University (Wuhan city in China is considered the epicentre of the epidemic) on Jan 30th, one day before the sample was collected (link). This analysis lines up with the tree showing this case as a common ancestor for other more distant.
- Other countries like Brazil, Italy and Taiwan are in the deepest branches from the root of the tree, which could indicate a few degrees of infection from China’s first generation of infection.
Conclusions
Using tools like the phylogenetic trees can become a valuable resource for certain purposes as we saw earlier, hopefully there will be a day where this kind of tools will help decision makers in real time, building world wide automated monitoring systems that will trigger alarms as soon as any unusual case is discovered, like the COVID-19, which seems to be a cross-species SARS infection.
Unfortunately COVID-19 evidenced that the world is not yet ready for a pandemic and we have a lot yet to learn.
If you want to read a Genomics study of cancer you can read here.


